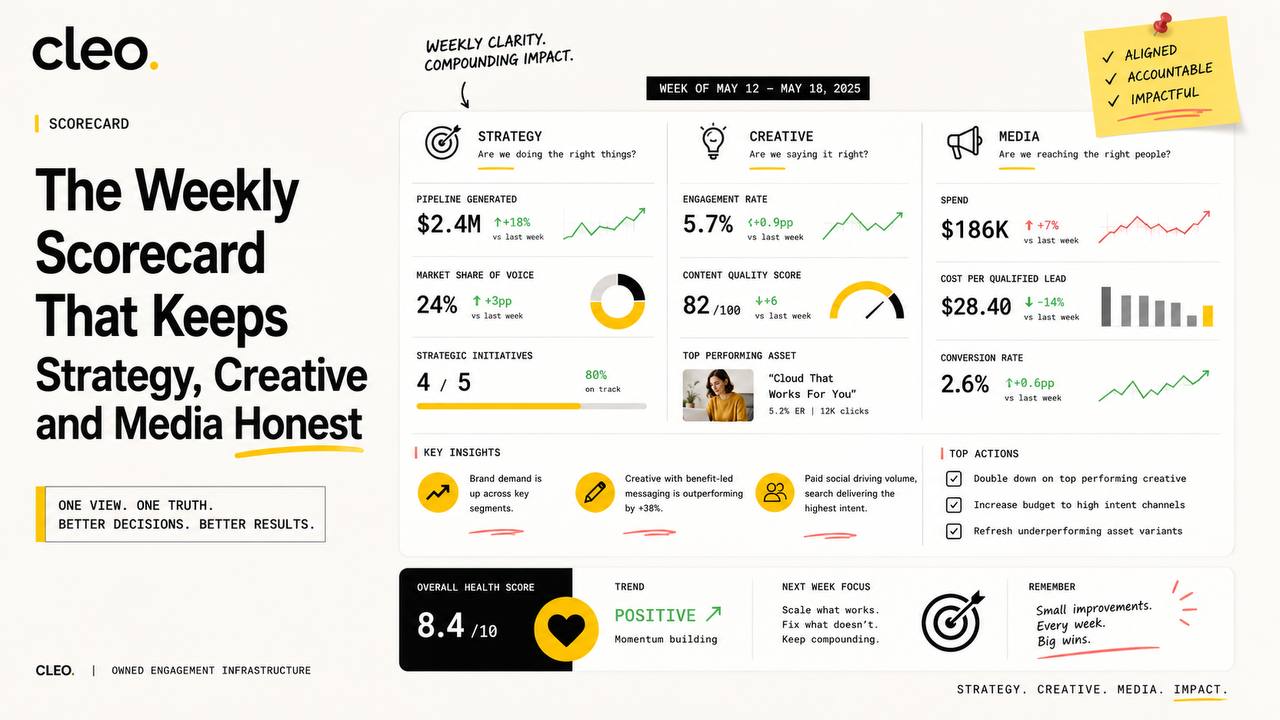
This is the fifth piece in our series on why campaigns fail to convert. If you're new to it, Why Most Campaigns Fail to Convert is the lead article, The Fragmentation Tax covers what a split marketing stack actually costs, The Creative Effect makes the case for creative as the biggest lever most businesses under-fund, and AI Without Strategy Is Just Faster Chaos covers where AI genuinely earns its place. This piece is the operating rhythm that keeps all of it honest once a campaign is live.
Why a scorecard, not a dashboard
A live dashboard feels sophisticated. It also gets checked constantly and acted on prematurely, particularly on anything that needs a full week of data to mean something. A weekly pull, reviewed at a set time, is a better discipline than a number that's technically always live but rarely stable enough to actually act on mid-week.
The scorecard's job is simple: hold strategy, creative and media accountable to the same conversion number, at a cadence each part of that picture can actually support.
What goes on it
A minimum viable version, per channel, per week:
| Channel | Spend | Leads | Cost per Lead | Qualified Leads | Cost per Qualified Lead | Conversion Rate | Opportunities | Trailing Cost per Customer | Week on Week Change | Flag |
|---|
The last two columns are what turn this into a scorecard rather than a report. Week on week change catches a sudden spike worth investigating before it compounds. The flag column is where decisions actually get made, so the scorecard tells you what to look at, not just what happened.
The two decision rules that do most of the work
If the qualification rate sits below roughly 10%, flag the channel regardless of how cheap the raw cost per lead looks. A cheap lead that almost never becomes a real opportunity is a targeting or creative problem wearing a low cost per lead disguise, and the raw number will never surface it on its own.
If cost per qualified lead looks competitive but the trailing cost per customer still won't clear a healthy return against lifetime value, flag it as a commercial problem, not a media problem. No amount of campaign optimisation fixes a channel where qualified leads simply don't turn into revenue at a sustainable cost. That's a pricing, sales cycle or retention conversation, not one for the media plan.
Everything that doesn't trip either rule needs no action beyond noting the trend. Most weeks, for most channels, that's the outcome, and that's fine. The scorecard exists to catch the exceptions, not to manufacture a decision every week for every line.
Why this only works if the handoffs are already gone
A scorecard doesn't fix fragmentation, it exposes it. If your creative team, media buyer and strategist are three separate vendors who've never sat in the same room, the scorecard will show you a channel with a widening gap between cost per lead and cost per qualified lead, and nobody on the call will know whether that's a creative problem, a targeting problem, or a landing page problem, because nobody owns all three.
This is why the scorecard sits at the end of this series rather than the start of it. It's the discipline that keeps an already integrated campaign honest. It's not a substitute for building one.
Where speed still decides whether any of this pays off
None of the above matters if a qualified lead sits in a queue once it arrives. Leads contacted within five minutes are 21 times more likely to qualify than those left for thirty, and only around 7% of companies actually hit that window. This is the specific, measurable place where Foundry's AI layer earns its place on the scorecard: every qualified lead a campaign generates gets a genuine response inside that five minute window, rather than joining the 47 hour average most businesses are quietly living with.
FAQ
How often should this actually be reviewed? Weekly, at a fixed time, rather than as a live dashboard checked constantly. Cost per lead is available same day. Qualification data usually needs a week to settle. Cost per customer needs longer, a month or more for most B2B sales cycles, but a trailing figure on the weekly scorecard is more useful sitting next to this week's numbers than no figure at all.
What's the most common mistake businesses make building this? Building the scorecard before the underlying data is trustworthy. Inconsistent tracking, or a lead source field that's only half populated, produces numbers that look precise and are quietly wrong. Fix that first, even if it delays the scorecard by a few weeks. A scorecard nobody trusts is worse than no scorecard.
Does this replace the need for a monthly or quarterly report? No. It's the operating rhythm that catches problems while they're small and cheap to fix. The monthly or quarterly view is still where the bigger commercial decisions get made, but those decisions are far better informed when they're built on twelve or thirteen weeks of honest, consistent scorecard data rather than a single snapshot.
Explore how Cleo builds the reporting discipline into every campaign from day one. Visit /how-we-work/